You’re probably already familiar with Google Chrome, one of the most popular web browsers available today. But did you know that Chrome has a built-in set of tools that can help you inspect, debug, and optimize web pages and applications?
These tools, known as the Chrome DevTools, are a powerful resource for developers and can help you streamline your workflow and become more efficient and effective. In this tutorial, we’ll explore some of the hidden features of the DevTools console and show you how to unlock their full potential.
Getting Started
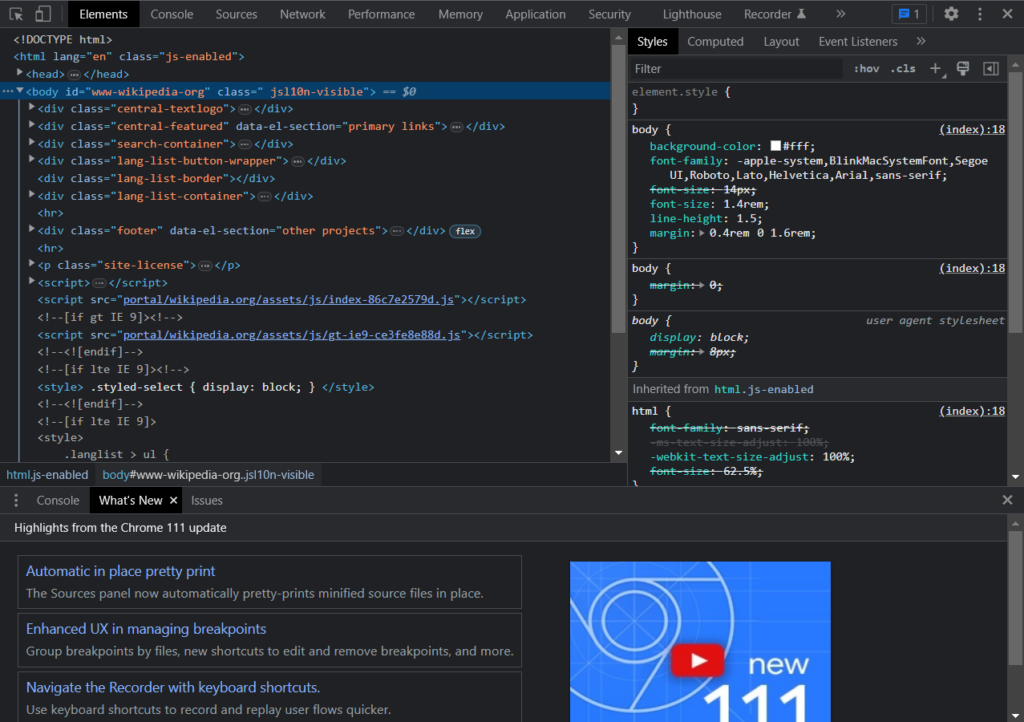
To gets started with the Chrome DevTools, press the Ctrl + Shift + I keyboard shortcut in Google Chrome for Windows (Command + Option + I on Mac). Once you have the DevTools open, you can start exploring its features.

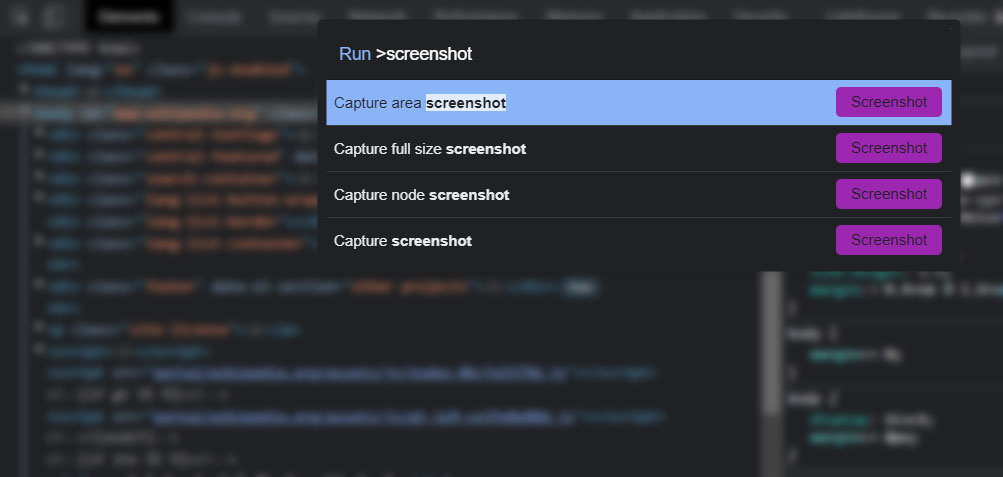
One of the handiest features is the Command Menu, which can be accessed by pressing the Ctrl + Shift + P keyboard shortcut while inside DevTools. The Command Menu allows you to quickly search and execute various options, such as changing the theme, capturing screenshots, and debugging JavaScript code.
Take a full screenshot of a web page using Chrome
Have you ever wanted to take a screenshot of an entire web page on your desktop? Rather than doing it manually with something like Print Screen and a Graphics Editor, simply follow these steps in DevTools:
- Open the DevTools using the keyboard shortcut Ctrl + Shift + I (Windows) or Cmd + Option + I (Mac).
- In the DevTools, click on the “Command Menu” button (or press Ctrl + Shift + P / Cmd + Shift + P) and type “screenshot”.
- Select the “Capture full size screenshot” option to capture a screenshot of the entire page, or select “Capture node screenshot” to capture a screenshot of a specific element on the page.
- Once you select the desired option, the screenshot will be captured and displayed in a new tab in the DevTools.
- From there, you can right-click on the image and select “Save image as” to save the screenshot to your computer.
The screenshot command can be useful for capturing visual bugs, documenting page layouts, or sharing information with team members or clients.

Inspect Webpages like a pro
In addition to the screenshot command, there are many other practical commands and features in the Chrome DevTools that can be used for increased productivity.
Console
The console is a powerful tool for debugging JavaScript code and exploring the Document Object Model (DOM) of a web page. You can use it to log messages, inspect elements, execute JavaScript code, and more.
Network
The Network panel in the DevTools allows you to monitor network activity and analyze the performance of a web page. You can use it to track requests and responses, view response headers, simulate different network conditions, and more.
Elements
The Elements panel allows you to inspect and modify the HTML and CSS of a web page. You can use it to identify and fix layout issues, experiment with different styles and layouts, and more.
Sources
The Sources panel allows you to debug JavaScript code and analyze the runtime performance of a web page. You can use it to set breakpoints, step through code, profile performance, and more.
Device Mode
Device Mode allows you to emulate different mobile devices and test how a web page will look and perform on different screen sizes and resolutions. You can use it to identify and fix layout issues, test touch interactions, and more.
Keep Exploring!
These are just a few examples of the many commands and features in the Chrome DevTools that can be used for increased productivity. By mastering these tools, you can streamline your workflow and become a more efficient and effective developer.
You May Also Like
- How to Secure a Memcached Server from UDP Attacks
- WordPress Invalid JSON Response: Simple Fixes for a Frustrating Problem
- Assigning User Account IP for Outgoing Mail Sending in Postfix (CWP/CentOS/Ubuntu)
- Installing php-ext-brotli on CWP PHP Switcher, CGI Selector, and PHP-FPM Selector
- How to Work Smarter in Windows using Windows Key Shortcuts
